
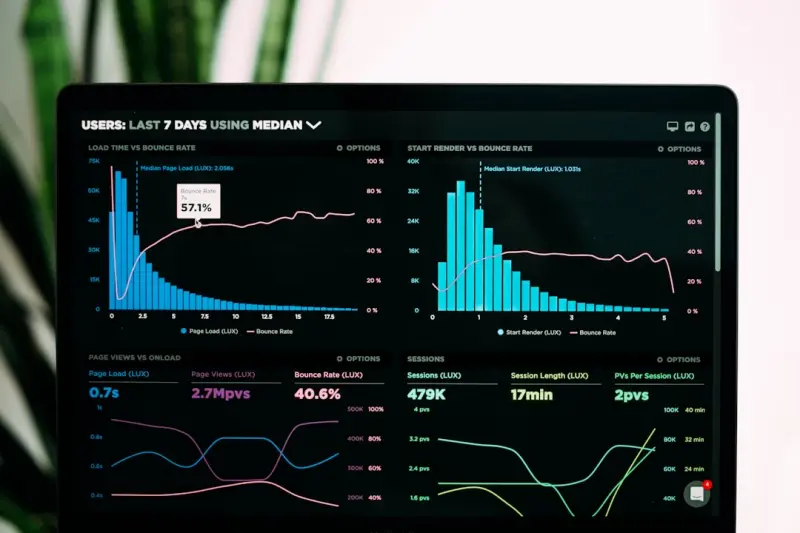
Imagine walking into your workday with the same confidence you have when you check the weather forecast before stepping outside. You know whether to grab an umbrella or slather on sunscreen, and you feel prepared for whatever the day throws at you. What if you could bring that same predictive clarity to your mental well‑being? In my own restless quest for balance, I discovered that the secret isn’t a mystical practice or a one‑size‑fits‑all ritual—it’s a simple, data‑driven “mental health dashboard.”
Why a Dashboard, Not a Do‑It‑Yourself Diary?
For years I kept a notebook of vague thoughts—“felt anxious” here, “great energy” there—only to stare at pages of cryptic scribbles that never quite added up. The problem wasn’t the lack of self‑reflection; it was the lack of structure. A dashboard gives you consistency and visual clarity. By turning subjective feelings into quantifiable metrics, you create a feedback loop that tells you not just what you’re feeling, but why you might be feeling it.
Think of it as the strategic AI co‑pilot for your mind. Instead of guessing, you have a real‑time readout that informs decisions—whether to schedule a deep‑work block, take a brief walk, or power through a challenging conversation.
Choosing the Right Metrics
The beauty of a mental health dashboard is that it can be as lean or as elaborate as you need. I recommend starting with three core pillars:
- Mood – Rate your overall emotional tone on a 1‑10 scale.
- Energy – Track physical vitality, also on a 1‑10 scale.
- Stress – Capture perceived stress levels, again 1‑10.
These three numbers, logged twice daily (morning and evening), give you a triangulated view of your mental state. Over time, patterns emerge: perhaps you notice a dip in energy after back‑to‑back meetings, or a spike in stress when your inbox hits a certain threshold.
Tools That Make It Easy (Without Adding Clutter)
If you’re already using a SaaS platform for project management, don’t rush to buy a separate app. Many tools have native “custom fields” or “widgets” that can host simple numeric inputs. For those who prefer a dedicated space, lightweight habit‑tracking apps or even a Google Sheet can serve as the canvas for your dashboard.
Remember the lesson from the nature‑infused home office trend: the environment should support, not distract. Keep your dashboard visible—perhaps as a pinned widget on your desktop or a sticky note on your monitor—so you’re reminded to log in without hunting for a hidden app.
Turning Data Into Action
Collecting numbers is only half the story. The real magic happens when you translate trends into concrete actions. Here are a few strategies I’ve tested and refined:
- Energy‑Based Scheduling: If your morning energy consistently scores above 8, block your most cognitively demanding tasks for that window.
- Stress‑Triggered Micro‑Breaks: When stress climbs above a 6, schedule a five‑minute micro‑meditation or a quick stretch.
- Mood‑Linked Social Check‑Ins: Low mood scores paired with high stress can signal a need for a brief, supportive conversation with a teammate.
By pairing each metric with a pre‑planned response, you avoid the paralysis of “what now?” and instead act with intention.
Integrating the Dashboard Into Team Culture
While the dashboard is a personal tool, it can become a catalyst for collective well‑being when shared responsibly. Consider these low‑risk ways to weave it into your team’s rhythm:
- Anonymous Pulse Surveys: Aggregate mood, energy, and stress scores weekly (without names) and discuss trends during retrospectives.
- Well‑Being Check‑In Channels: A dedicated Slack channel where teammates post a quick “☀️ 8/9/7” emoji combo to signal their current state.
- Leadership Modeling: When managers share their own dashboard snapshots, it normalizes the practice and reduces stigma.
Transparency, when handled with care, builds trust. Your team will see that mental health isn’t a hidden agenda but an integral part of performance.
Guarding Against Data Overload
It’s tempting to add more metrics—sleep quality, nutrition, screen time—but remember the principle of “minimum viable insight.” Each new data point should answer a specific question; otherwise you risk the very burnout you’re trying to prevent. A simple rule of thumb: if a metric doesn’t drive an actionable response within 48 hours, drop it.
Iterate, Reflect, Refine
Just as software undergoes sprints, your dashboard should evolve. Every month, set aside 15 minutes to review the past period:
- Identify spikes or dips and trace back to events or habits.
- Adjust thresholds—maybe a stress level of 5 is now the trigger for a break.
- Celebrate wins: a week of steady high energy is worth acknowledging.
This iterative loop keeps the dashboard relevant and ensures it remains a tool for empowerment, not a source of pressure.
Closing Thoughts: From Data to Delight
When I first built my mental health dashboard, I feared it would feel clinical—like turning my inner world into a spreadsheet. Instead, it became a compassionate mirror, reflecting back the subtle rhythms of my mind. The data didn’t replace intuition; it sharpened it. By embracing a modest, data‑driven habit, I reclaimed a sense of agency that many of us lose amid endless meetings and inbox avalanches.
If you’re ready to swap guesswork for clarity, start today: pick a notebook, a spreadsheet, or a simple app, log three numbers, and watch the patterns emerge. Your future self will thank you for the insight, the calm, and the confidence to navigate each workday with purpose.

When it comes to the world of blogging and writing, Rose DesRochers is a name that stands out. Her passion for creating quality content and connecting with her audience has made her a trusted voice in the industry. Aside from her skills as a writer and blogger, Rose is also known for her compassionate nature.
Related Posts

Mapping Mental Fatigue: A Practical Guide to Recognizing and Recharging Your Cognitive Energy
This article explains what mental fatigue is, how to identify its signs, and provides a three‑step... Read More

Crafting a Personal Mental Health Toolkit That Actually Works
A practical guide to building a personalized mental‑health toolkit using bite‑sized habits—bre... Read More

Mental Fitness in the Moment: Turning Tiny Tasks into Big Resilience
Discover how brief, intentional mental workouts—focused attention snippets, emotional reset routin... Read More
Top Posts
The Unexpected Power of a Personal‑Care Journal
By chronicling skin, mood, and environmental factors, a personal‑care journal turns everyday routines into insightful, data‑driven rituals that enhance both...Read More

How to Launch an Employee‑Led Innovation Lab and Accelerate Impact
A step‑by‑step guide to creating an employee‑led innovation lab, from identifying the right problem to securing resources and measuring success....Read More

Balcony Forests: Turning Tiny Outdoor Tiles into Lush Sanctuaries
Discover a step‑by‑step guide to turning a modest balcony into a thriving mini‑forest, complete with reclaimed‑material planters, low‑tech irrigation,...Read More

Travel’s New Frontier: Crafting a Personal Sensory Blueprint for Every Trip
Learn to design trips that engage sight, sound, smell, taste, and touch, creating deeper memories and a more restorative travel experience....Read More
0 Comments
Post Comment
You will need to Login or Register to comment on this post!