
Why You Need a Mental Bandwidth Dashboard
When I first started measuring my own cognitive load, I thought I was being a bit obsessive. After all, we already have fitness trackers, sleep monitors, and endless apps that tell us how many steps we’ve taken. But none of those tools ask a crucial question: how much mental capacity am I actually using right now? The answer, I discovered, can be the difference between a day of focused creativity and a day of frantic multitasking that leaves you drained.
In the tech‑heavy world we inhabit, mental bandwidth is a scarce commodity. It’s the invisible budget that determines whether you can solve a complex bug, write a persuasive proposal, or simply enjoy a quiet cup of coffee without your brain buzzing with notifications. When that budget is overdrawn, the symptoms show up as anxiety, decision fatigue, and a creeping sense that you’re not living up to your own potential.
This post is an invitation to treat your mind the way you treat your finances: with a clear, real‑time dashboard that helps you allocate, monitor, and protect your mental resources. I’ll walk you through the core components of a mental bandwidth system, share practical tools you can implement today, and show how this approach dovetails with existing mental‑health practices like Narrative Journaling and Visual Hygiene.
The Science of Cognitive Load
Before we dive into the dashboard, let’s ground the concept in research. Cognitive load theory, originally formulated for instructional design, identifies three types of load:
- Intrinsic load – the inherent difficulty of the task itself.
- Extraneous load – unnecessary distractions or poorly designed interfaces.
- Germane load – the mental effort dedicated to learning and problem solving.
In a typical workday, these loads fluctuate wildly. A high‑stakes client call spikes intrinsic load, while a barrage of Slack pings adds extraneous load. If germane load is constantly squeezed out, you’ll feel mentally depleted.
What most productivity literature fails to address is the cumulative effect of these loads across a week, a month, or even a quarter. That’s where the dashboard comes in: a visual representation that aggregates real‑time data, helping you spot patterns before they become chronic stressors.
Building Your Mental Bandwidth Dashboard
The beauty of this system is that you can start with tools you already have—Google Sheets, Notion, or a dedicated habit‑tracking app. Below is a step‑by‑step guide to set up a functional prototype.
1. Define Your Core Metrics
Choose a handful of indicators that reflect the three types of cognitive load. Here are some suggestions:
- Task Complexity Score – rate each major task on a 1‑5 scale based on perceived difficulty.
- Interruptions Count – track the number of external alerts (emails, messages, meetings) per hour.
- Focused Time Blocks – log the duration of uninterrupted work (e.g., Pomodoro sessions).
- Mood & Energy Rating – a quick self‑assessment at the start and end of the day on a 1‑10 scale.
- Physical Environment Score – a brief check of visual clutter, lighting, and ergonomics (linking to Visual Hygiene principles).
2. Choose a Visualization Format
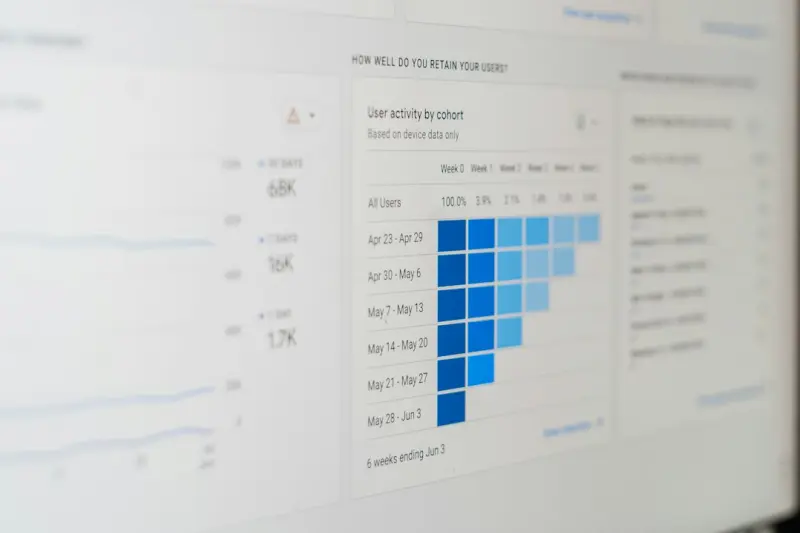
Heat maps work well for spotting peaks and troughs. A simple line graph can illustrate the trend of your Focused Time Blocks over the week, while a stacked bar chart can compare Intrinsic vs. Extraneous load each day.
3. Automate Data Capture Where Possible
If you use a task manager like Asana or Jira, export the “estimated effort” fields to feed your Task Complexity Score automatically. For interruptions, consider a browser extension that logs the number of Slack or Teams notifications you receive.
4. Set Thresholds and Alerts
Define what “too much” looks like for you. For instance, if you log more than 8 interruptions in an hour, a notification could prompt you to enable “Do Not Disturb.” Similarly, a dip in Mood & Energy below 4 should trigger a scheduled break or a short mindfulness exercise.
5. Review and Iterate Weekly
At the end of each week, spend 15 minutes reviewing the dashboard. Identify recurring spikes—maybe every Tuesday you have a team sync that adds a high intrinsic load, or Friday afternoons see a surge in extraneous load due to end‑of‑week email catch‑up. Use these insights to renegotiate meeting structures or batch communication.
Integrating the Dashboard with Existing Mental‑Health Practices
Creating a mental bandwidth dashboard is not a stand‑alone solution; it amplifies the effectiveness of other well‑established practices.
Pair with Narrative Journaling
When you log your Mood & Energy Rating, take a minute to jot a short narrative note about the day’s emotional tone. Over time, you’ll develop a rich archive that reveals how specific load patterns affect your mental state. This synergy turns raw numbers into stories you can actually learn from, echoing the power of Narrative Journaling for resilience.
Apply Visual Hygiene Principles
Extraneous load often stems from visual clutter—overstimulating dashboards, endless tabs, or a chaotic desktop. By implementing Visual Hygiene habits—such as limiting open windows, using dark mode, and decluttering your physical workspace—you reduce the baseline noise that competes for attention.
Micro‑Mindful Breaks as a Counterbalance
When your dashboard signals a prolonged period of high intrinsic load, schedule a micro‑mindful break. Even a 60‑second breath awareness exercise can reset the prefrontal cortex, improving focus for the next task block.
Real‑World Scenarios: How the Dashboard Saves the Day
Below are three fictional (but plausible) case studies that illustrate the dashboard’s impact.
Case 1: The Overloaded Product Manager
Maria, a product manager at a fast‑growing SaaS firm, found herself constantly juggling feature specs, stakeholder meetings, and urgent bug triage. Her Task Complexity Score regularly hit 5, while her Interruptions Count averaged 12 per hour. The dashboard highlighted a pattern: every Monday morning, her “Focused Time Blocks” dropped to under 30 minutes.
Armed with this data, Maria negotiated a “No‑Meeting Monday” policy for the first two hours of the day. She also batch‑processed Slack messages into a dedicated 15‑minute window. Within a week, her Mood & Energy Rating rose from a chronic 3 to a steady 6, and the team reported higher feature delivery velocity.
Case 2: The Remote Designer Facing Visual Overload
Leo, a UI/UX designer working remotely, struggled with a desktop littered with design files, research PDFs, and open browser tabs. His Physical Environment Score was consistently low, contributing to a high extraneous load. The dashboard’s heat map showed a correlation between low scores and dips in his Mood & Energy Rating.
Implementing a visual hygiene routine—closing unused tabs, organizing files into clearly labeled folders, and adopting a minimalist wallpaper—boosted his Physical Environment Score to 8. His focused work sessions doubled in length, and his creative output improved, leading to a promotion.
Case 3: The Burned‑Out Engineer
Sam, a senior backend engineer, was experiencing chronic burnout. His dashboard revealed a steady increase in Interruptions Count (averaging 20 per hour) and a sharp decline in Germane Load, as measured by the duration of deep‑work blocks. He also noted a trend: after every sprint demo, his Mood & Energy Rating plummeted.
Sam used the data to propose a “Demo‑Free Day” after each sprint, giving the team a buffer to decompress. He also introduced a rule that non‑critical Slack messages be marked with a low‑priority tag, allowing him to filter them out during deep‑work windows. Within two sprints, his Mood & Energy Rating rebounded to a stable 7, and his code review turnaround time improved by 15%.
Common Pitfalls and How to Avoid Them
While the mental bandwidth dashboard is a powerful tool, it’s easy to fall into traps that undermine its purpose.
- Over‑Tracking: Logging every minute detail can become another source of extraneous load. Stick to a core set of metrics and refine as needed.
- Data Paralysis: Seeing a lot of numbers without actionable insight leads to frustration. Prioritize clear visual cues (e.g., red flags) that prompt immediate action.
- Neglecting the Human Element: Numbers can’t replace the nuance of a conversation. Use the dashboard as a conversation starter with managers, not as a performance scoreboard.
- One‑Size‑Fits‑All: Your cognitive load profile is unique. What works for a developer may not suit a marketer. Tailor the metrics to your role and personal stressors.
Tools and Resources to Get Started
Below is a quick list of tools you can use to build your dashboard without writing a single line of code:
- Notion – Create a table with formulas to calculate weekly averages and embed line charts.
- Google Sheets – Leverage the
IMPORTXMLfunction to pull data from task‑management tools. - RescueTime – Automatic tracking of focused vs. distracted time, which can feed directly into your dashboard.
- Zapier – Connect Slack, Asana, or Trello to your spreadsheet for real‑time updates.
- Mindful App (e.g., Headspace, Calm) – Integrate short mindfulness prompts when the dashboard signals high load.
Making the Dashboard a Habit
The ultimate goal is to make mental bandwidth monitoring as effortless as checking the weather. Here’s a three‑step habit loop to embed it into your routine:
- Trigger: Open your dashboard first thing after logging into your computer.
- Action: Update the key metrics for the morning (e.g., set your Mood & Energy Rating, note any scheduled high‑load tasks).
- Reward: Spend a minute reflecting on the day’s anticipated mental budget; notice the peace of mind that comes from having a plan.
Over time, this loop becomes automatic, and you’ll find yourself naturally adjusting your workload before stress spikes.
Looking Ahead: The Future of Cognitive Load Management
Imagine a world where your laptop’s operating system nudges you to pause when your cognitive load crosses a threshold, or where AI curates your calendar to balance high‑intensity meetings with low‑intensity work blocks. While we’re not quite there yet, the foundations are being laid today through dashboards like the one we’ve built.
By treating mental bandwidth as a measurable asset, you empower yourself to make data‑driven decisions about when to push forward, when to step back, and how to protect the most valuable resource you have—your mind.

Shawn DesRochers is a certified Microsoft technician and Programmer with 30+ year's experience. He has written many reviews on computer related products, software, and SEO related topics. When he's not writing reviews he can be found at one of the Oldest Directories Online Blogging Fusion Business Directory which he is the CEO of.
Related Posts

Tiny Social Check‑Ins: A New Habit for Everyday Mental Clarity
Micro‑check‑ins are brief, intentional moments to ask how you’re feeling, turning everyday pau... Read More

Micro‑Goal Mastery: Tiny Wins for a Resilient Mindset
Discover the science behind micro‑goals and a step‑by‑step system to embed tiny, dopamine‑bo... Read More
Digital Minimalism: Trim Your Screen, Find Calm
Learn why endless scrolling harms your brain and how to create screen‑free zones, manage notificat... Read More
Top Posts

Playful Reboot: Harnessing the Science of Play to Boost Workplace Mental Health
A fresh look at how integrating playful activities into daily routines can transform workplace mental health, boost productivity, and foster a culture of wellbe...Read More

Building Asynchronous Collaboration Cultures for Distributed Teams
Learn why shifting to asynchronous collaboration can transform productivity and employee satisfaction. This guide offers a step‑by‑step playbook, real‑wor...Read More

The Quiet Health Engine: Harnessing Daily Gratitude for Better Well‑Being
A daily gratitude habit may seem modest, but its impact on brain chemistry, hormone balance, and immune function is profound. Learn how to integrate this simple...Read More

Beyond Job Descriptions: Crafting Adaptive Employment Frameworks for the Future
A deep dive into shifting from static job descriptions to flexible, outcome‑driven employment frameworks, leveraging skill graphs, micro‑ladders, and modern...Read More
0 Comments
Post Comment
You will need to Login or Register to comment on this post!